Learning how to check your site speed doesn’t need to be daunting. This short guide will give you the basics, and point you in the right direction.
There’s no single metric
The first thing to understand is that there is no single metric or measurement for ‘speed’. There’s no simple number which you can use to measure how quickly your pages load.
Think about what happens when you load a website. There are lots of different stages and many different parts which can be measured. If the network connection is slow, but the images load quickly, how ‘fast’ is the site? What about the other way around?
Even if you try to simplify all of this to something like “the time it takes until it’s completely loaded“, it’s still tricky to give that a useful number.
For example, a page which takes longer to ‘finish loading’ may provide a functional ‘lightweight’ version while the full page is still downloading in the background. Is that ‘faster’ or ‘slower’ than a website which loads faster, but which I can’t use until it’s finished loading?
The answer is, “it depends”, and there are many different ways in which we can think about or measure ‘site speed’.
Understanding the loading process
From the moment when you click on a link (or hit ‘enter’ in your URL bar), a process begins to load the page you requested.
That process contains many steps, but they can be grouped into broad stages which looks something like this:
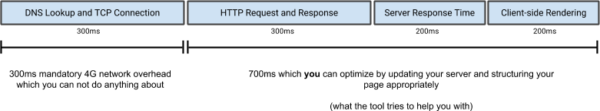
The “one second timeline” from Google’s site speed documentation
While Google’s documentation might be a bit ambitious about the timings of these stages, the model is helpful. Essentially, the process can be described as three stages of loading.
1. Network stuff
First up, the physical hardware of your device needs to connect to the Internet. Usually, that involves moving data through transatlantic fibre cables. That means that you’re limited by the speed of light, and how quickly your device can process information.
It’s hard to measure or impact this part of the process!
2. Server stuff
Here, your device asks your server for a page, and the server prepares and returns the response.
This section can get a bit technical, as it’s focused on the performance of server hardware, databases and scripts. You may need to ask for help from your hosting provider or tech team.
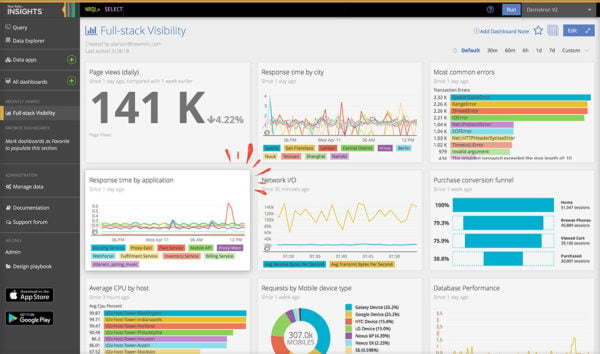
We can measure the performance of the server with tools like NewRelic or DataDog, which monitors how your site behaves and responds from the ‘inside’.
They’ll provide charts and metrics around things like slow database queries and slow scripts. Armed with this information, you can get a better understanding if your hosting is up to scratch and if you need to make code changes to your theme/plugins/scripts.
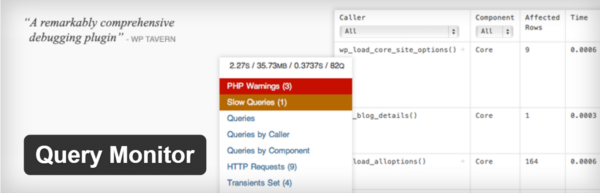
The Query Monitor plugin for WordPress
WordPress has some great plugins for doing this kind of analysis, too – I’m a big fan of Query Monitor. This provides some great insight into which bits of WordPress might be slowing you down – whether it’s your themes, plugins, or environments.
3. Browser stuff
This stage is where the page needs to be constructed, laid out, colored in, and displayed. The way in which images load, in which JavaScript and CSS are processed, and every individual HTML tag on your page affects how quickly things load.
We can monitor some of this from the ‘outside-in’ with tools which scan the website and measure how it loads. We recommend using multiple tools, as they measure things differently, and are useful for different assessments. For example:
- WebPageTest is great for providing a ‘waterfall’ view of the website, and how all of the assets load.
- Google PageSpeed Insights is a bit simplistic, but it provides ‘real user metrics’ of your website, straight from Google.
- Lighthouse for Chrome provides an incredibly sophisticated analysis of the performance and behaviour of the site, but it can be hard to digest!
- Chrome Developer Console shows you exactly what’s happening as your site loads, on your computer, in your browser.
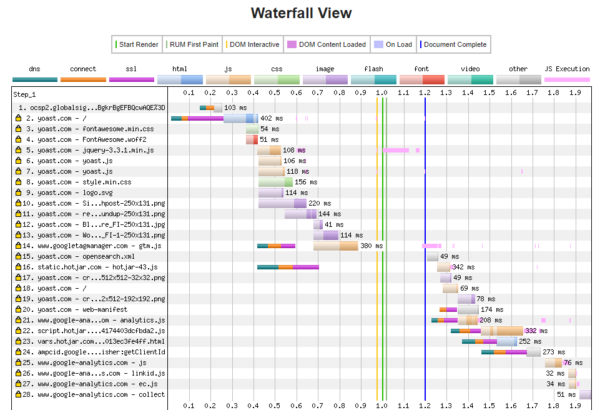
WebPageTest results for yoast.com
These kinds of tools are great for spotting things like images which need to be optimized, where your CSS or JavaScript is slow, or where you’re waiting for assets to load from other domains.
Universal metrics
Despite all of these moving parts, there are a few universal metrics which make sense for all sites to measure, and optimize for. These are:
- Time until first byte, which is how long it takes until the server responds with some information. Even if your front-end is blazing fast, this will hold you up. Measure with Query Monitor or NewRelic.
- Time until first contentful (and meaningful) paint, which is how long it takes for key visual content (e.g., a hero image or a page heading) to appear on the screen. Measure with Lighthouse for Chrome.
- Time until interactive, which is how long it takes for the experience to be visible, and react to my input. Measure with Lighthouse for Chrome.
These are much more sophisticated metrics than “how long did it take to load”, and, perhaps more importantly, have a user-centric focus. Improving these metrics should correlate directly with user satisfaction, which is super-important for SEO.
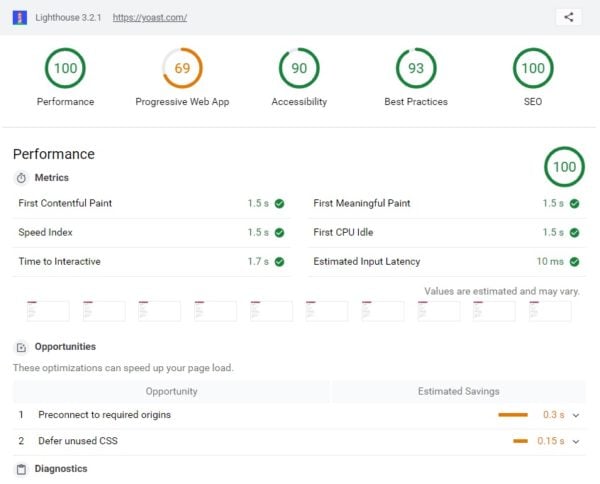
A Lighthouse report for yoast.com showing key metrics
You can read more about these metrics in Google’s documentation.
Wrapping this into a process
- Use an ‘outside-in’ tool, like WebPageTest to generate a waterfall diagram of how the website loads.
- Identify bottlenecks with servers and the back end. Look for slow connection times, slow SSL handshakes, and slow DNS lookups. Use a plugin like Query Monitor, or a service like NewRelic to diagnose what’s holding things up. Make server, hardware, software and script changes.
- Identify bottlenecks with the front end. Look for slow loading and processing times on images, scripts and stylesheets. Use a tool like Google PageSpeed Insights or Lighthouse for Chrome for suggestions on how to streamline how the page loads.
- Use Lighthouse for Chrome to measure your key metrics, like time until first meaningful paint and time until interactive.
Have we missed anything? Let us know in the comments!
Read more: Improving site speed: Tools and suggestions »
The post How to check site speed appeared first on Yoast.
No comments:
Post a Comment